Category "Reports"

Since the end of October, When he played the most of 3,25%, the rate DEA 10 years began a steep decline to the current levels in which went through much of the year (2,85%-2,90%).

At the same time, short term interest rates also registered falls, Although to a lesser extent. In this way, differential rates between different times is at minimum levels of the year.

If we take as a reference rates to 10 y 2 años, as shown in the preceding graphic, the current differential is only 0,12%.

This behavior of rates, You can guess is that compression occurs due to a strong increase of the fly to quality bonds long at a time of global uncertainty.


In Europe, the behavior of the rates is similar. In the case of England, the evolution of rates to 2 y 10 years after reaching highs also in October (0, 90% in the case of the of 2 years and 1,70% in the case of the rate to 10), It gradually fell to current levels of 0,69% y 1,20%, respectively.


On the other hand, in Germany, After reaching levels of 0,60%, the rate of 10 fell to the 0,25% current. While the rate of 2 years has remained relatively stable in 0,60% negative.

In both cases, the behaviour evidenced between the long and short term rates, It is equal to what has happened in United States, the differential between both periods shrinking in the last month and a half. However, the differential between the time limits in the case of European countries, shows a greater prize, of 0,50% in England and 0,80% in Germany.

By way of conclusion, as seen above, Detaches a process of deepening of the fly to quality, especially in the cases of Germany and United States. This behavior increases the risk of a devaluation in the rest of financial assets.


United States

SPY

In the case of the US stock market, It has respected the support mentioned in our report of the 29 October, around USD 260 by action of the SPY ETF. Starting from there, had a strong rebound.

We maintain the level of USD 275 as the key to be able to infer that it starts a new bullish cycle.

An alternative for that eventuality but keeping a limited risk, would buy purchase options (o calls) of price in USD 275, in mid November at an approximate cost of around of the 1% mentioned the level of resistance exercise price.


Argentina

Banco Macro (BMA)

This action went bankrupt during the day, significantly, the level of resistance set in USD 45. At the same time, exceeded the moving average of 30 days. This means a buy signal but, to the significance of this day hikes, is expected greater volatility even with intra corrections.

Grupo Financiero Galicia (GGAL)

The action of the Banco Galicia broke the resistance mark in USD 25, with a rate hike during the day (mid wheel) del 12%. Apply the same comments to the Banco Macro.

French Bank (BFR)

In the case of the French Bank, the previous behavior already indicated the possibility of rate hike, recommending have positions. During the day, This trend is consolidating and we maintain our recommendation to be purchased with a new stop-loss in USD 11,00.

Banco Supervielle (SUPV)

As in the previous case, We had recommended to have positions by a previous buyer tendency. The same is confirmed during the day and the stop-loss You should upgrade to USD 8.

Cresud (CRESY)

Despite the rise of today, We believe there is no confirmed a break the downward trend. We should expect 2 o 3 wheels above the level of USD 13 to infer a new bullish cycle.

Telecom (TEO)

This action has been lateralizando since the beginning of the month of August. As we indicated in the previous report, a break of the resistance in USD 20 would enable subsequent hikes of certain relevance.

Edenor (EDN)

Edenor is also showing a side trend since early September. We have the breakdown of the level of USD 24 as a clear sign of further hikes.

Pampa energy (PAM)

The action of Pampa is approaching the level of resistance of USD 35 by ADR. The breakdown of such level enables subsequent hikes.

YPF (YPF)

This action is showing a bullish recovery, which is confirmed with the breakdown of the level indicated the 29 October, in USD 16,50.

Transportadora de Gas del Sur (TGS)

From three wheels maintains an uptrend. We still recommend to have positions, with new stop-loss in USD 14.


Brazil

Brazilian shares have also reflected upward movements, but in a proportion much lower than what was observed during the day in Argentine actions. ETF EWZ of Brazilian shares has broken the resistance of USD 40, whereupon we recommend to take positions with stop-loss in USD 39,50.

With regard to global stock markets, are still looking bearish corrections of any relevance, both in central countries emerging. Our basic recommendation is to not have positions in significant weighting in the Portfolio shares. You must wait until there are clear signs of positive trends.

The past 10 October we indicate signs of downward trend regarding the evolution of the US stock market. Since then, the evolution of the SPY (ETF composed by 500 companies) evidenced brackets that were key breaks and accumulated several days of significant casualties. In total, in October, builds up a low on the 8,50%.

We remind that a bull market in the United States is not enough for similar behaviour in other countries, but If it is essential to not be a negative trend to enable other markets recorded.


  • The main trend is bearish.
  • He broke the stand at USD 270 and deepened losses.
  • Currently, the next support is at USD 260. Break it, It could extend the low.
  • To recover a positive trend, You should overcome the level of USD 275 and to hold up during several wheels.
  • The short-term moving average cut down their counterparts in the medium and long term.


  • After reaching highs of 3,25%, It continued to show slight falls and is currently located in lathe to the 3,10%-3,15%.
  • The main trend is still bullish.
  • We estimate a rate of 10 years in 3,50%-3,60% the coming year by mid-century.


  • It stays within the bearish channel.
  • Slight rise in the past few days after hitting the support at the level of USD 36.
  • To consolidate a trend reversal should break the level of USD 45.
  • We recommend the break above resistance before taking positions.


  • It keeps the negative trend.
  • To achieve a change of trend you should break the level of USD 25.
  • We do not recommend to have positions.


  • Held lateralizando between USD 12,50 and USD 10 Since mid-September.
  • To consolidate an uptrend it should break the level of USD 12,50.
  • We recommend to have positions with stop-loss at the level of the channel support.


  • Is testing key resistance at the level of USD 8.
  • Break this resistance, settle a new uptrend.
  • We recommend to have positions with stop-loss in USD 7, current support.

  • It stays within the bearish channel.
  • He broke down the support at the level of USD 12,50, deepening trend.
  • We do not recommend to have positions.


  • He is currently lateralizando in levels between USD 17 and USD 20, without a clear trend.
  • To consolidate an uptrend it should break the level of USD 20.


  • It stays within the bearish channel.
  • It maintains support at the level of USD 21.
  • To consolidate a trend reversal must break the level of USD 24.


  • It stays within the bearish channel,
  • I am a support at the level of USD 30.
  • To achieve a change of trend you should break the level of USD 35.
  • We do not recommend to have positions.


  • It stays within the bearish channel.
  • Mild bullish rebound in recent days after hitting a floor at the level of USD 13,50.
  • To consolidate a trend reversal must break the level of USD 16,50.


  • The main trend is still negative, Despite the strong bullish rebound during the month of September.
  • I am a support at the level of USD 13.
  • To consolidate a trend reversal must break the level of USD 16,50.
  • We recommend to have positions with stop-loss in USD 12,50.


As for Brazil, consummate Bolsonaro victory in presidential elections, the evolution of assets seems to show that the former military victory was discounted in prices.


  • After mark a double floor in USD 32 and break a first resistance in USD 37,50 at the end of September, EWZ continued moving upward until you find a second top level, around USD 40.
  • In this level is ranging from early October.
  • It is important that you get to break the USD 40 during the upcoming wheels to continue the upward trend.
  • Downward, key support is in USD 37,50.


  • Similar to the EWZ graphic, with a double floor around USD 2,00 and a bullish rally since the beginning of September.
  • He found strength in USD 2,65, approximately, and support in USD 2,45 (current level of the average of short-term).
  • Consolidated the break stand at USD 2,45, You can return to the minimum levels reached at the end of June and beginning of September (USD 2,00).


  • It shows the same upward trend that started the Brazilian stock exchange in early September.
  • Currently, found in levels of resistance in USD 16,00.
  • Downward, the level control is in USD 15,00.


  • It accompanies the general trend of the stock market of Brazil: a double floor (in USD 10,00) followed by an upward trend since the beginning of September.
  • During the bullish rally, broke a resistance in USD 12,50 and formed a second in USD 13,50.
  • For the continuation of the trend, It is important that you get to break this second resistance.


  • Within a bullish channel since the beginning of year.
  • In September accelerated hikes, accompanying the rest of the Brazilian actions, He broke on the upside the main channel and found strength in USD 16,00.
  • From the top, accumulate successive falls who returned to situate it within the channel.
  • Currently, prices near to a level that can be considered is support, approximately in USD 14,60.
  • If you respect the support, You can start a new attempt of break on the upside of the channel. On the other hand, failure to comply, casualties could continue until the lower boundary of the channel USD 13,00.


In the following report, We carry out an analysis of the evolution of the country risk of Argentina and other countries of comparable, by being in the same region or by their characteristics since the beginning of the year 2018.

Since mid-September, at the same time a currency run and the start of renegotiations with the IMF, We saw a rebound in risk country for Argentina, only accompanied by Ecuador and towards the rail from the rest of the countries analysed.

As a result, the differential on average returned to peak levels reached this year (above the 300 basic points). Anyway, the last days, the Argentine country risk as measured by JP Morgan had a slight drop and approached again the 600 points, shrinking the differential again.

As we mentioned earlier, the other countries remained stable after the decline in levels that have been shown since the end of August. This behavior of the JP Morgan indicator is amid the acceleration in the increase in the yield of the 10 Treasury years, which is already located around the 3,20% annual.

We continue to consider the level of 600 basis points for Argentina's country risk as a level of "Balance" for the short and medium term, and that it will take many months to reach an acceptable level of 400 points. This last level, It is the maximum which could be considered taking new debt. In a scenario positive, It should reach by the end of the year coming.

At the same time, We believe that financial operators will assess new monetary and fiscal policy agreed in the new agreement with the IMF for months, waiting for a reduction in the fiscal deficit and also an important reduction of the exchange rate volatility, before entering a new stage of significant purchase of Argentine sovereign bonds.

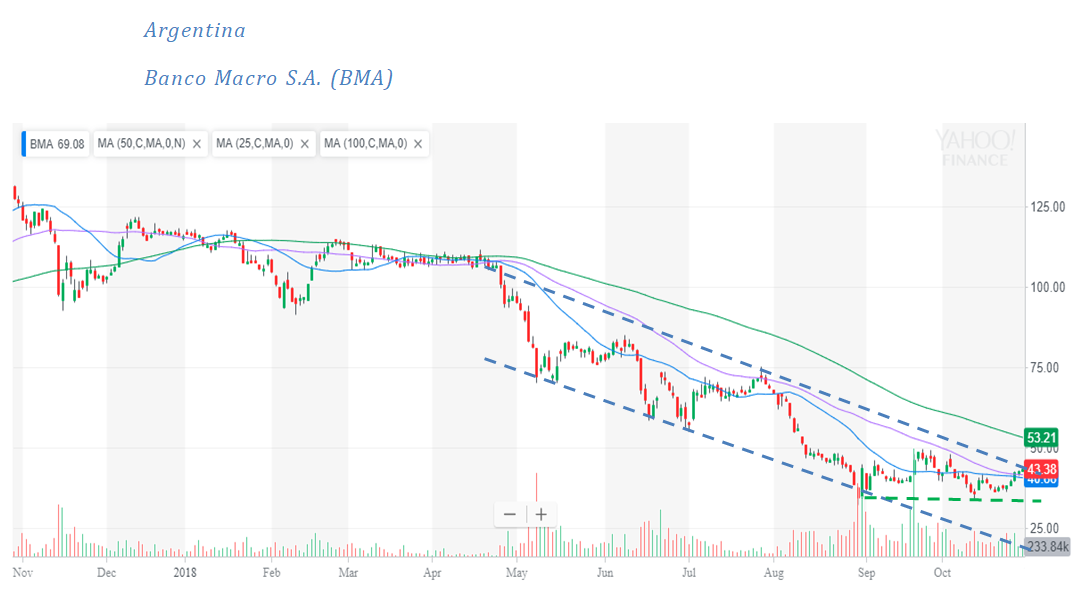
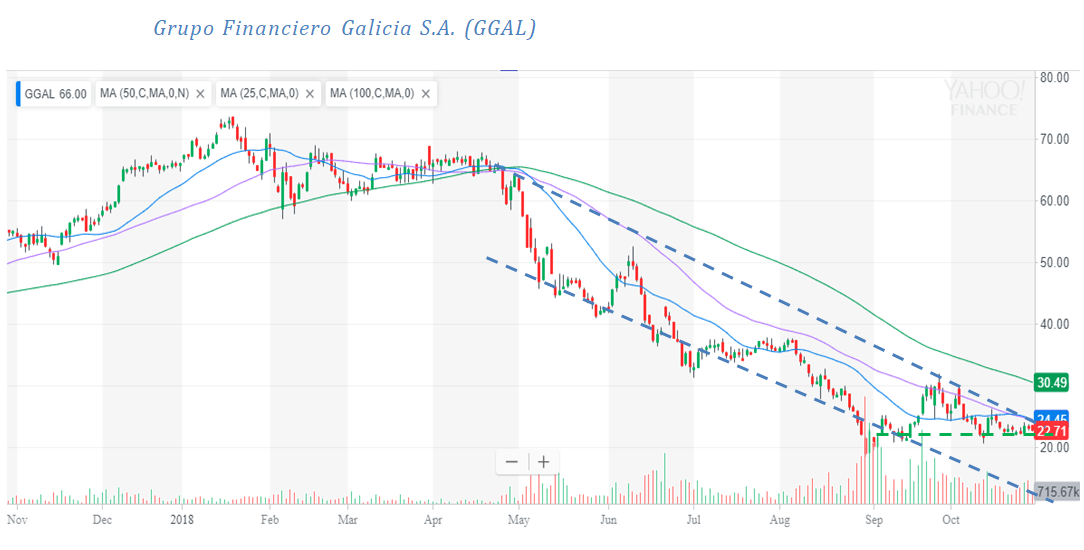
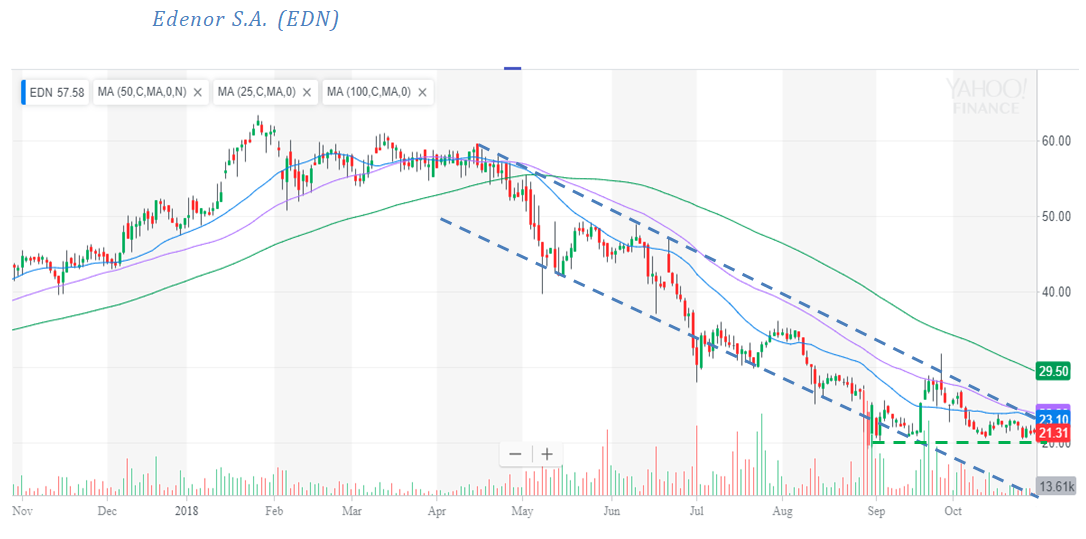
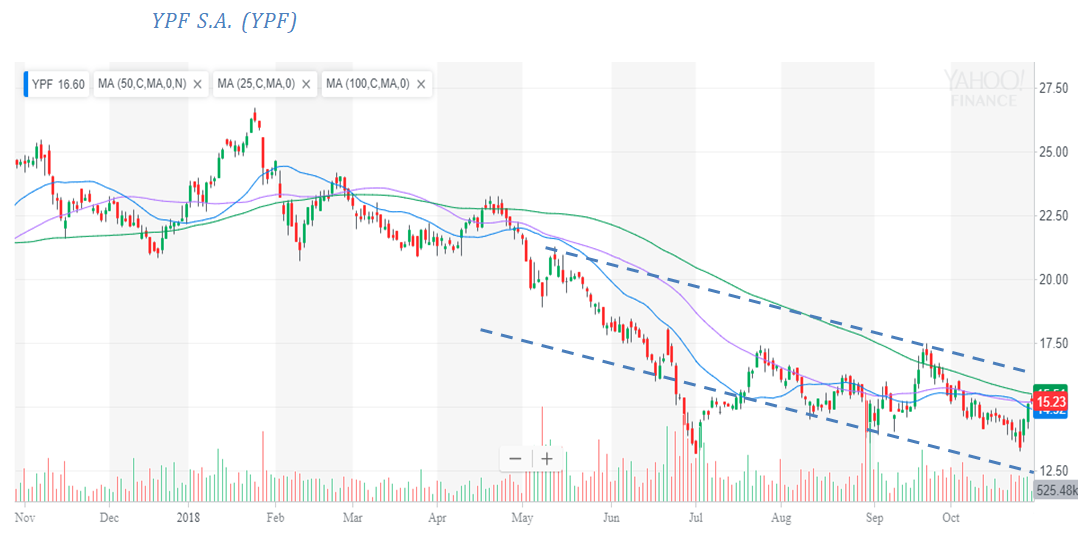
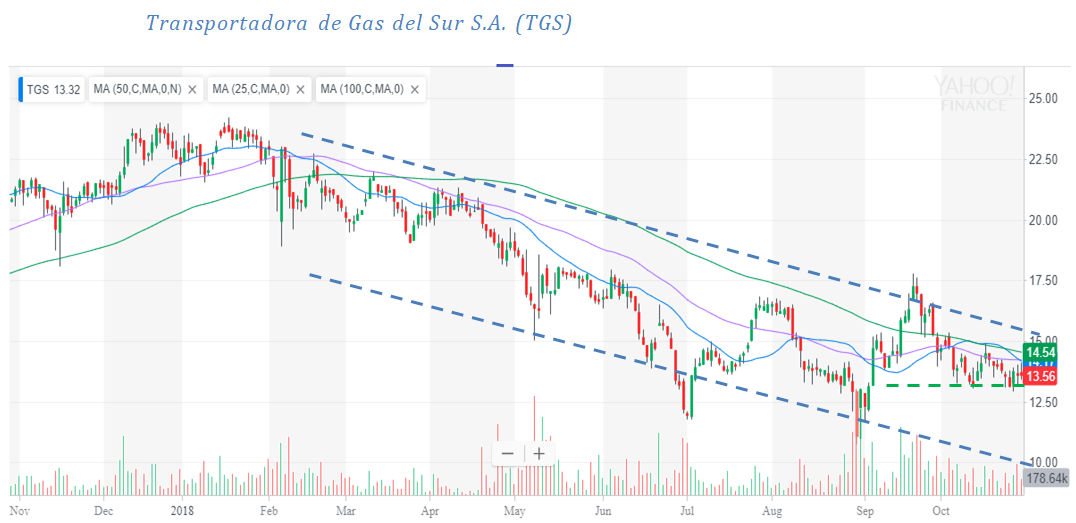
The clearly negative trend observed in the Argentine actions, It is enhanced with some negative behaviors on top-level exchanges and in emerging.

In General, the upward trend in the United States has not been invalidated in strong. However, movements of the past few days have increased significantly the possibility of a change of trend.

We remind that a bull market in the United States is not enough for similar behavior in other developed or emerging countries.

But, It is essential that the price of shares in the United States do not have negative trend to enable hikes in other markets.


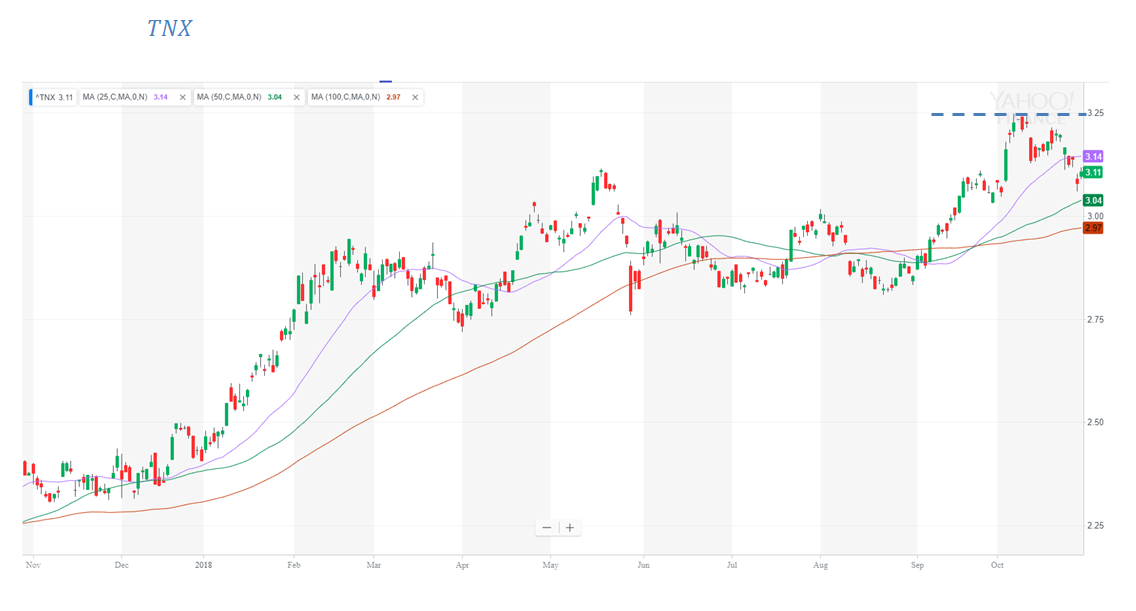
The evolution of the Treasury rate to 10 años, It showed an uptrend even though he was a resistance level around the 3/3,10% annual. The breakdown of this resistance during late September and early October, it accelerated the rise in the interest rate that today sits on the lathe to the 3,25% annual.

Although the hikes in U.S. interest rates. UU. was something expected by markets., such acceleration had impact on the behavior of markets.

We estimate that the rise will continue, reaching the level of 3,50% annual.


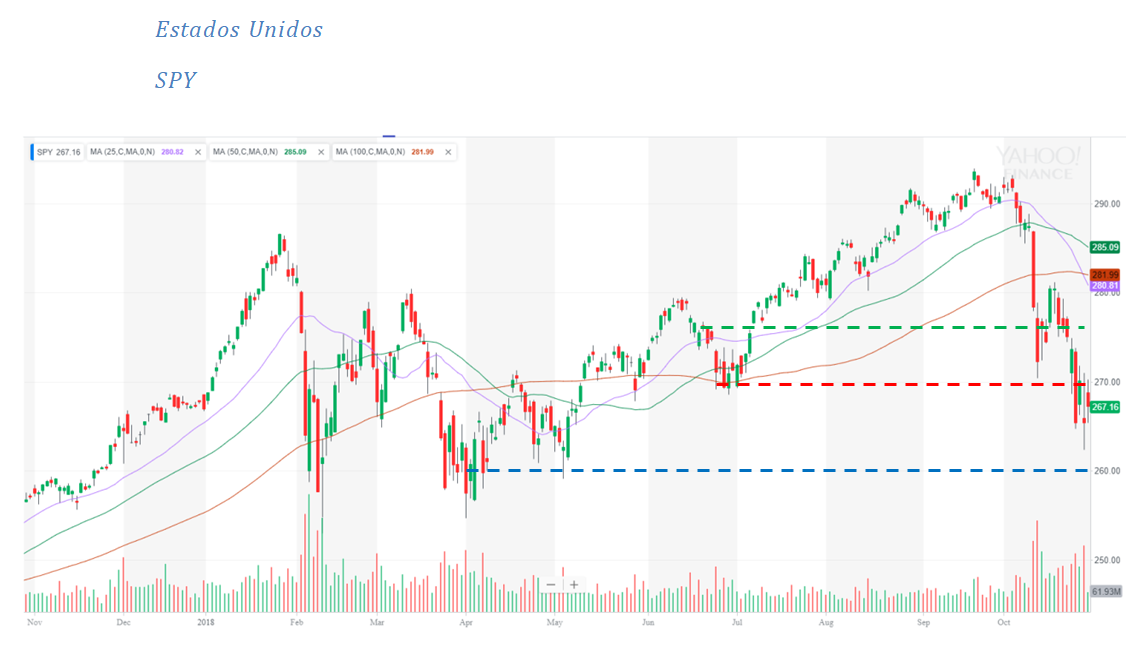
In the case of the SPY, It continues into the bullish channel that we have been marking, Although it is currently testing the levels of support. You must assess the level of USD 280 still posing as a level of break key to the formation of a trend change.

Daily casualties of the 1% Or more, just as it is happening on today, they are a negative sign to take into account. We remind you that this ETF is composed by 500 companies.


From mid-October, the euro demonstrates a depreciation of almost a 2,50% with respect to the dollar. At the same time, Since may, the tendency of the value of the dollar against the euro is slightly bullish. Obviously, influences the very high differential rates of interest between United States and Germany.


Analyzing the Germany ETF, EWG, It should be recalled that you priced in dollars while the assets in which invests quoted in euros. That being said, the evolution of the exchange rate becomes important in the behavior of the ETF. At the same time in which the euro depreciated 2,50%, the ETF fell in a 5,50%.

On the other hand, the main trend of the EWG shows a bearish channel main. With the decline of the last days, It is in support of the same levels. Break it down profundizaría falls.


The Brazilian real shows a sharp appreciation of more of the 10% Since the 4,20 Reals per dollar, to the 3,75 BRL/USD today. To technical signals, the current level is presented as a level support key.

Obviously, the final result of the elections and the team that the new President will be key. Is virtually ruled out that the winner is Bolsonaro.


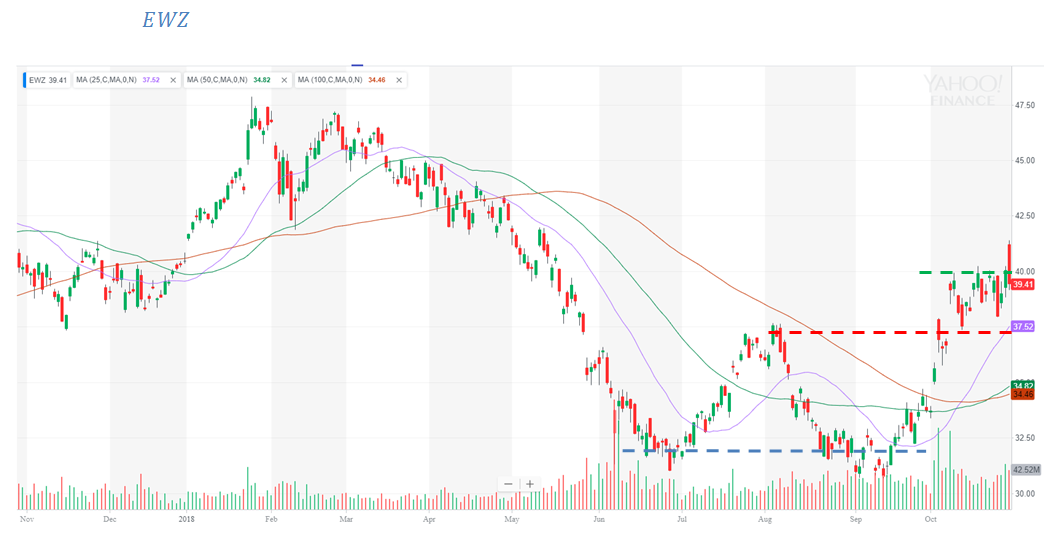
In the same period in which the real has appreciated a 10%, the Brazil ETF (EWZ) He had a bullish rally of almost a 25%.

In terms of technical analysis, the tendency of the EWZ bullish signs, with a double floor around USD 31,50. With the latest rise, it reached the level of USD 40, breaking a resistance that presented at the level of USD 37,50 and that is now presented as a key level to respect as a support.

Achieve sustained above that level would be a positive signal for the formation of an uptrend.


The Turkish lira reached a minimum of 7 lire to the dollar in mid-August. Since then, It showed appreciation to the current levels of 6 TRY/USD. This is, an appreciation of little more than the 14%.


During the same time, the ETF MSCI that follows the Turkish market, showed an improvement of almost a 20% from the achieved minimum mid-August, up to the current level around USD 22,60.

After mark support at the lows reached in mid-August, around USD 20, He recorded successive hikes during the following month, coming to break the main bearish channel on the rise.

It is important to, for the continuity of this new trend, that you hold over USD 21,50.

Since the start of the talks with the representatives of the IMF for the reformulation of the agreement, country risk fell significantly from the peak of 780 reached points at the beginning of September, up to the 590 points and, as well as the general of the Argentine assets, sovereign bonds in USD accumulated several consecutive positive wheels.

However, last week showed a further increase in the perception of the risk on Argentina. How this dynamic reflex, bonds were lower bounded.


We are still considering that there are local and international variables that can significantly alter the expectations. By which, We believe that the technical analysis of the behavior of markets gives us an adequate interpretation of how va fluctuating vision of the main financial operators that have positions in local bonds.

Then, We performed a technical analysis on some of the bonds with more trading volume. For this analysis, We use the parities of the bonds (the ratio between the market price and the technical value of rescue at every moment), to eliminate changes in product for the payment of services of interest quotes.

Except for the bond Discount, analyzed bonds got to fail upward the main bearish channel in which had been running since the beginning of April. It is important that, to the negative evolution of the last 2 o 3 days, get hold above levels support we make later.


  • After you conform stand in 92 parity, He began a cycle of successive positive wheels and broke the main bearish channel resistance.
  • Currently in 98,50 parity.
  • We had established the level of 98 as a key level for the change of trend. If he manages to hold itself above during 3/4 Conference, would confirm the trend reversal.


  • As in the previous case, I respect the stand and started a brief cycle upward until you reach the 90 parity.
  • Then it fell again into the main bearish channel.
  • The level of 90 is presented, then, as resistance and level key so that we will see a change of trend.
  • Is currently in 86,50 parity, approximately.


  • Recently broke the main bearish channel on the rise, until you reach the 86 parity.
  • It is important to, for a confirmation of the trend reversal, that is held above the level of 80 parity.
  • Currently, maintains parity of 81, approximately.


  • It broke upward level we established for trend reversal, around the 75 parity.
  • He continued his upward path and established a new resistance in 80%.
  • For the confirmation of the new trend, It should hold itself above the level of 75 mentioned above.
  • Currently, the parity is of 78.

In the following report we carry out an analysis of the evolution of the country risk of Argentina and other countries of comparable, by being in the same region or economic characteristics, Since the beginning of the year 2018.


Since the end of the month of August, the vast majority of the countries surveyed have lowered its country risk. It should be noted that Argentina is the country that fell to a greater extent, falling a 25% Since the peak at the beginning of the current month. This is the distance between Argentina and the average has also fallen significantly. In recent days, we can see that Ukraine began to lateralizar, While Argentina, Brazil and Turkey continue to fall.

We believe that at the level of the 600 basis points risk country of Argentina will stabilize and that must pass some months to reach an acceptable level of 400 basic points, necessary to take new debt at reasonable rates.

At the same time, We also believe that the traders will want to see several months of fiscal deficit reduction and significant reduction in the exchange rate volatility, before entering a new stage of significant purchase of Argentine sovereign bonds.

Header

When the INDEC updated prices of GDP base year of 1993 a 2004 in the year 2014, It should have been updated the GDP basis the conditions of issuance of the coupon of GDP as stipulated in the prospectus of issuance. However, different interpretations arise from the clarification in the prospectus:

One interpretation suggests that it should be used as Update factor the year 2012, while another interpretation suggests that the year should be used 2004. On the other hand, IAMC interprets that it can be used as a factor any year between 2004 y 2012.

The national Government, it not ruled yet on how the prospect of emission in terms of the change of base year should be interpreted.

Even the Government announced the 26 of June of 2016 its intention to repurchase the coupons to bondholders by the end of 2016 through a Necklace. However, None of that has happened yet.

The GDP coupon payments, they are enabled if they are met 2 conditions

1) GDP to grow above as set forth in the prospectus of issuance, that starting from 2017 ES 3%

2) GDP at constant prices is greater than the GDP of the baseline scenario for a given year.

If you meet both conditions, the equivalent will be paid to the 5% of the surplus (in pesos, being the payments in dollars, the amount in local currency divided by the exchange rate of the year in which growth occurs) described in point 2.

Hence the importance of the factor to be used for the updating of the baseline scenario, which will determine the payment enabling, y, If Yes, the amount to be paid.

The differences are substantial: If you are using the factor of the year 2004, the over GDP would be negative, and the payment does not enable ever, unless there is growth "at Chinese rates" for several years. On the other hand, If using the factor of the year 2012, the over GDP would be positive, and grow more than 3% in any year, payment authorization.

Remaining to pay around US$ 12,000 million.

If the Government opts for the update factor of 2004, exposed to potential lawsuits for considerable sums of money, in all jurisdictions where the instrument has been issued.

These caveats, We will use the factor of the year update 2012 (the most beneficial) and we propose 2 scenarios:

  • Scenario 1: growth superior to the 3% for all the years since 2017 en adelante.
  • Scenario 2: lower growth to the 3% for the years 2017 y 2018 and growth superior to the 3% starting from 2019 inclusive.
    • In both scenarios are discounted payment flows to the 5% y 7,5% annual.

In view of the results, even in more negative than those exposed scenarios, The TVPA and TVPY are assets with great potential, but can present a scenario in which the Government chooses to update scenario with the factor base of 2004 and in this case the total investment would be lost.

Conclusion

In view of the results, even in more negative than those exposed scenarios, The TVPA and TVPY are assets with great potential, but can present a scenario in which the Government chooses to update scenario with the factor base of 2004 and in this case the total investment would be lost.

Header 1

Cuadro USD

TIR projections mentioned in the table above are associated with those assets with higher maturity to 2025, a differential of 400 b.p. performance of the asset in comparison with similar assets of USA (and an extra penalty of 10 b.p. by law argentina) and an increase of 25 b.p. all USA bonds bond curve. For bonds maturing prior to the 2026 the projected rate results from multiplying 2,25 times the American rate (over the 25b.p. previously mentioned).

This scenario implies maintaining the same level of existing TIR bonds shorter and a fall of TIR maximum of 0,5 percentage points in the long bond. As a result, short bonds accrued current coupons until end of year, While long bonds as well as the accrual will have a capital gain, accentuated by its duration.

The result is that, If the scenario, short bonds will have a direct performance year-end on the 5% and the longer bonds have yields direct on the 10% What makes them more attractive in relative terms. It should be noted that the AY24 is the asset with lower potential, given that it is expensive compared to similar bonds.

Apart from the stability of the American Treasury bonds rate during the last few weeks, We recommend to buy instruments where one can reduce the negative effect of one bullish movement of these rates for the local bonds.

Header 2

Cuadro PESOS

The table above shows how much would be gained / I would lose too much buying a sovereign bond fixed rate rather than a Lebac to 280 days to different changes of TIR.

Assets fixed Peso rate would be a surpassing alternative only if she is to verify higher IRR falls to 2 percentage points (today is found between 14% y 17% Depending on the period). The likelihood of that happening is very low in the short term under analysis. Por lo tanto, We consider that the Lebac (in all their terms) they are the best alternative assets within fixed Peso rate.

Lic. Juan Marco Lavagno

jlavagno@maxinver.com

Lic. Mariano Alejandro Peretti Fontana

mperetti@maxinver.com

Header Carteras

Below are the structures of investments in financial assets preferred by MAXINVER for different models of portfolio investment based on its "benchmark".

Portfolio theoretical MAXINVER in dollars:

-30% Sovereign bonds up to 2021 (Performance 5%-5,5%)

-35% Provincial and corporate bonds between 2021 y 2028 (Performance 7,5%-8,5%)

-30% Subsequent sovereign bonds to 2028 (Performance 7%-7,5%)

-5% The American Government interest rate coverage

After the success of the money laundering, the adoption of the new law of profits, and the stabilization of the rate of interest American,emerging bonds are an attractive investment for portfolio alternative in dollars. In this context, Argentine assets have the highest yields in the region, 200 basis points over Brazil, y 250 basis points above Colombia, Uruguay or Chile. This situation is extended to a variety of provincial and corporate assets in the stretch half of the yield curve, that you have superior performance than the sovereigns. The longest sovereign bonds not only possess an attractive income but also the possibility of spread compression.

In all cases, and given the risk of a rise in American interest rates, We suggest to buy "rate coverage" in foreign markets.


Theoretical portfolio MAXINVER in Pesos:

-30% Long-term CER

-40% LEBAC

-30% BADLAR +

The LEBAC yields remain the most attractive since its average yield is the equivalent of BADLAR + 3% and their market price incorporates the daily accrual of such rate of return.

Those assets that fit by CER are included, Since we anticipate an inflation for the year 2017 in the range of 20%-22,5% annual. The preferred bond ESthe DISCOUNT in $, whose performance, the prices of the date of this report, is of 4 annual percentage points above inflation. The allure of the performance of this asset compensates for long life.

In the stretch of BADLAR assets that fit, We believe that existevalor in corporate assets with yields above 3,5% above BADLAR.


Theoretical MAXINVER absolute return portfolio:

-20% Actions (15% in banks + 5% in YPFD)

-15% LEBAC

-10% Long-term CER

-5% BADLAR +

-20% Provincial and corporate bonds between 2021 y 2028 in USD

-25% Subsequent sovereign bonds to 2028 USD

-5% Coverage of the American Government rate

Given the compression of spreads ocurridaen the assets of fixed income from the month of December of 2016 and in an international context with greater appetite for equities boosted by expectation of American-led global growth and the expectation of growth in the domestic economy, We believe a good opportunity actions positioning, especially in the banking sector, energy and steel industry.

Whereas we anticipate a devaluation of the peso between 18%-20% for this year, It is attractive to invest in fixed income securities (sovereigns, sub-sovereign and corporate) dollar with yields above 7%, always with "coverage" of international rates.

Load More
Buenos Aires, Argentina. Copyright @ 2016 Maxinver | Todos los derechos reservados